Unveiling Insights: A Beginner’s Guide to Exploratory Data Analysis (EDA)
Introduction
In the realm of data science, Exploratory Data Analysis (EDA) stands as the crucial first step, akin to unraveling the secrets hidden within the numbers before delving into the complexities of advanced statistical or machine learning models. This article serves as a compass for those embarking on the journey of EDA, breaking down key points to ensure a comprehensive understanding of your dataset.
- Distribution of Data: Navigating the Landscape
To embark on a meaningful analysis, one must first understand the lay of the land. Visual aids such as histograms and box plots become invaluable guides, unveiling the distribution of data — whether it’s a symphony of normalcy or a dance of skewness. Summary statistics then take the stage, providing insights into central tendencies and the ebbs and flows of variability.
2. Missing Values: Bridging the Gaps
The landscape isn’t always complete, and missing data can be the elusive puzzle piece. Addressing these gaps is paramount, whether through imputation techniques, strategic deletion, or a deeper exploration into the reasons behind the voids. After all, a comprehensive map requires a complete picture.
3. Outliers: Navigating the Extremes
Outliers, the outliers — the rebels of the dataset. Their impact on analyses can be profound, demanding careful consideration. Are they to be removed, transformed, or studied further? Deciphering their tale ensures a nuanced understanding of the dataset’s narrative.
4. Correlations: Unraveling Relationships
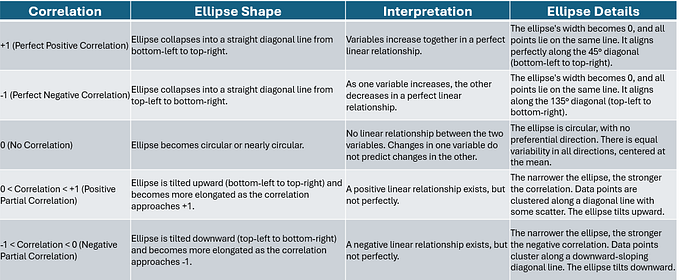
Variables often dance in pairs, and understanding their choreography is key. Correlation coefficients and scatter plots step in as partners, revealing intricate relationships and potential dependencies. It’s the waltz of variables — a dance that can guide subsequent analyses.
5. Patterns and Trends: The Story Unfolds
Every dataset has a story to tell. Line graphs, bar charts, and time-series analyses become our storytelling tools, helping us decipher patterns, unveil trends, and spot anomalies. The narrative unfolds, offering insights that might be missed in the raw data.
6. Group Comparisons: Contrasting Narratives
Just as characters in a story bring contrast, so do different groups within a dataset. Comparing metrics across categories or time periods unveils significant differences or surprising similarities. It’s the comparative analysis that adds depth to our understanding.
7. Data Type Assessment: Knowing Your Characters
Data types are the characters in our dataset narrative — numerical, categorical, ordinal. Understanding their roles and appropriate treatments lays the foundation for a coherent analysis. Each type plays a unique part in the story.
8. Data Quality Assessment: Polishing the Plot
No story is without its flaws. Evaluating data quality helps identify errors or inconsistencies, ensuring a polished plot devoid of misleading twists. It’s the editorial process that enhances the reliability of our findings.
9. Visual Exploration: Painting the Canvas
Visual exploration is the artistry of EDA. Heatmaps, pair plots, and other visualization tools paint an intuitive canvas, allowing us to grasp complex relationships effortlessly. It’s the visual symphony that transforms raw data into meaningful insights.
Conclusion
Embarking on the journey of Exploratory Data Analysis is akin to embarking on a thrilling adventure. Armed with histograms, scatter plots, and an insatiable curiosity, data scientists and analysts unravel the mysteries of their datasets. As we delve into the nuances of distribution, outliers, and correlations, our dataset transforms from mere numbers into a captivating narrative, waiting to be explored. So, let the exploration begin — for in the realm of data, every plot twist brings us closer to understanding the story it longs to tell.